Friday, 18 January 2013

Detailed Data Flow diagrams

Once context of a system has been captured using context level diagram, the analyst would expand his activities and start digging out system’s internal details. Therefore, the same context level diagram is further expanded to include all major processes of the system that make up system functionality. So, instead of portraying system as a black box entity, the analyst would add processes that deal with the external agents and produces certain outputs. This is level one of a data flow model.

In level two of data flow model, instead of refining the previous levels further, we take one process from the level one diagram and expands it in a level two diagram. Hence, a level one diagram that depict the whole system, may be expanded to more then one level two diagrams each of which describes exactly one process in detail which were listed in level one diagram as simply an oval (process or transform).

This process may continue to any level of details as the analyst can conveniently captures. Where diagram at a specific level is a refinement of one of the processes listed in a previous level. By adding levels of abstraction to a data flow diagram, it becomes natural for a software engineer or a requirement analyst to readily express his knowledge about the system in an appropriate level of data flow model that corresponds only to a specific set of functionality.

It should be noted here that the number of external agents and their inputs to the system and the outputs that the system would return to them, should remain the same throughout different levels of a data flow model. It should be considered a mistake if context level diagram contains three external agents, which are providing two inputs each, and getting one output in return but at level one, we add one more external agent or input or the outputs. This would make level one model inconsistent with the context level diagram. This is true for any level of data flow model. For instance, at level two the number of external agents, inputs and outputs shown in (all of level two) diagrams should match exactly with the external agents, inputs and outputs shown in level one diagram. Therefore, disseminating information at an appropriate level of abstraction with the additional check of inter-level consistency makes data flow modeling a very powerful domain-modeling tool. After this discussion, we shall give the reader an example in which a system is modeled using data flow modeling technique where three levels of abstraction have been developed.

Levels of Abstraction to Data Flow

4.4 Adding Levels of Abstraction to Data Flow Modeling

As we have already described that in data flow modeling only those processes can be expressed that perform certain processing or transformation of information. Now the question arises how far these processes need to be expressed? As a single process like Calculate Commission as described in the above section, can be described in sufficient detail such that all of its minute activities can be captured in the data flow diagram. However, if we start adding each bit of system functionality in a single data flow diagram, it would become an enormously large diagram to be drawn on a single piece of paper. Moreover, requirement analysis is an ongoing activity in which knowledge expands as you dig out details of processes. Therefore, it may not be possible for an analyst to know each bit of all the processes of the system from the very beginning.

Keeping the complexity of systems in view, data flow modeling technique has suggested disseminating information of a system in more then just one levels of abstraction. What are these levels, please see below for a discussion.

Context Level Data Flow Diagram

In a top-down system analysis, an analyst is required to develop high level view of the system at first. In data flow modeling, this high-level view is the Context level data flow diagram. In this diagram, system’s context is clarified such that all the external agents or entities with which the system interacts are captured. It captures the details of what information flows between the system and these external entities, and what outputs are generated against inputs from these external agents and so on. So, the analyst probes out all the external agents that may involve persons, organizations or other systems who directly interacts with this system and their specific involvement in the system. At this level, systems internal details are not exposed, as we want to see system behavior as a black box.

Next we will see Detailed Data Flow Diagrams.


Monday, 24 December 2012

Typical Processes in Data Flow

4.3 Typical Processes
Now we shall discuss processes which are typically modeled using data flow diagrams. These processes transform data in one or the other way but these are found in almost all the automated systems. Following are the examples
  •  Processes that take inputs and perform certain computations. For example, Calculate Commission is a process that takes a few inputs like transaction amount, transaction type, etc and calculates the commission on the deal.
  • Processes which are involved in some sort of decision-making. For example, in a point of sales application a process may be invoked that determines the availability of a product by evaluating existing stocks in the inventory.
  • Processes that alter information or apply a filter on data in a database.
For example , an organization is maintaining an issue log of the issues or complaints that their clients report. Now if they want to see issues which are outstanding for more then a weeks time then a filter would have to  be applied to sort out all the issues with Pending status and whose initiation date is a week old.
  •  Processes that sort data and present the results to users. For example, we pass an array of arbitrary numbers to a QuickSort program and it returns an array that contains the sorted numbers.
  • Processes that trigger some other function/process 
For example, monthly billing that a utility company like WAPDA, PTCL generates. This is a trigger that invokes the billing application every month and it prepares and prints all the consumer bills.
  • Actions performed on the stored data. These are called CRUD operations and described in the next subsection 
CRUD Operations
These are four operations as describes below
  • Create: creates data and stores it.
  • Read: retrieves the stored data for viewing.
  • Update: makes changes in an stored data.
  • Delete: deletes an already stored data permanently.

Saturday, 22 December 2012

Data Flow Modeling

When data flow modeling is used to model a system’s functionality, following points need to be remembered
  • Data flow model captures the transformation of data between processes/functions of a system. It does  not represent the control flow information that is occurring in a system to invoke certain functionality.
  • A number of parallel activities are shown in this diagram where no specific sequence among these activities is depicted
  • All the previous models that we studied like business process models, state transition diagrams, are used to capture business domain irrespective of their automation.
  • However, in data flow models, we represent only those processes which we need to automate as they involve certain computation, processing or transformation of data that can be best implemented using  an automated system.
  • For example, we may consider a mail desk in an office that receives mail and just forwards it to their respective addressees. In this example, as the mail desk does not process the mail, just forwards it,  therefore it does not include any process that need to be automated. Hence, we shall not use data flow diagrams to model this process.
  • In nutshell, processes that just move or transfer data (do not perform any processing on that data), should not be described using data flow models.
  • Taking the same example, if we modify the scenario such that a mail desk clerk receives the mail, notes it down into a register and then delivers it to their respective addressees then a processing has got involved in this scenario. At least one process is there that can be automated. That is, the recording of mail information into the register. Now we can use a data flow model in which wehall use a data transformation that captures the detail of recording mail information into a register (or a data store). Thus with this addition, it makes sense to use data flow model to capture the details of this process. 
Next post will be Typical Processes in data flow.

Bank Account Management Data Flow

Data Flow Model – Bank Account Management System

In the following, we are presenting a data flow model that describes an accounts management system for a bank. This data flow diagram consists of the following entities,

Click to Enlarge
 Processes
1. Reconcile account balance
2. Deposit funds into an account
3. Pay a bill
4. Withdraw funds from an account

External agents
1. Bank
2. Creditor
3. Employer
4. Other income sources

Data stores
1. Monthly Account statement
2. Bank accounts
3. Account transactions

Description:
First we shall discuss ‘withdraw funds from an account’ process. In this process, information about the  accounts and account transactions is retrieved (from the data stores) and bank releases the funds. After this,  it sends this information to ‘reconcile account balance’ process which prepares a monthly account statement.  In this statement, information regarding bank accounts and account transactions are described.  Next is the ‘pay a bill’ process through which a creditor pays his dues and the corresponding accounts are  updated against the cash transaction. A receipt is issued back to the creditor. The fourth process is ‘deposits  funds in an account’ in which an employer deposits salaries of his employees and the salary information is  deposited in the corresponding bank accounts of the employees. Similarly, income received through other income sources is also received and deposited in the corresponding bank accounts.

The next post will also concern to data flow having some Data Flow Modeling techniques.


Data Flow Versus Flow Charts

DFD versus Flow Charts

Flow charts are usually used to describe flow of control in a system. It describes control flow in an algorithm.  Flow charts are quite detailed. Whereas DFD does not captures control flow information, it just  shows the flow of the data in a system. Flow charts show the sequential activities of an algorithm. So,  decisions are made, loops or iterations are described. On the other hand, DFD does not show the sequential  activities. It just displays the business flow (without sequence among activities). As if you visit an  organization, business activities are being performed in parallel. Therefore, DFD does not contain control or  sequential activities just data transition is captured.

DFD DFD Flow Chart
-Processes on a data flow can operate in parallel.
-Looping and branching are typically not shown.
-Each process path may have a very different timing.
-Processes on flowcharts are sequential.
-Show the sequence of steps as an algorithm and hence looping and branching are part of flowcharts.

The Next will be the Example of Data Flow Model of Bank Account Management System.

Data Flow Model

Data Flow Model

  • Captures the flow of data in a system.
  • It helps in developing an understanding of system’s functionality.
  • What are the different sources of data, what different transformations take place on data and what are  final outputs generated by these transformations.
  • It describes data origination, transformations and consumption in a system.
  • Information is organized and disseminated at different levels of abstraction. Thus this technique  becomes a conduit for top down system analysis and requirements modeling.
The Notation
There are several notations of the data flow diagrams. In the following, four different shapes are explained.

Process
  • What are different processes or work to be done in the system.
  • Transforms of data. 
Process

External AgentExternal systems which are outside the boundary of this system. These are represented using the squares

External Agent
 Data Store
  • Where data is being stored for later retrieval.
  • Provides input to the process
  • Outputs of the processes may be going into these data stores.
Data Store
 Data Flow
  • Where the data is flowing.
  • Represents the movement of the data in a data flow diagram.
Data Flow

Information in Tabular Form

Arranging information in tabular form

Sometimes it is better and more convenient to arrange information in a tabular form. This makes it easier for  the reader to understand and comprehend the information and hence designing, coding, and testing become  less challenging. As an example, let us look at the following definitions used for identifying different data  functions in the function point analysis taken from International Function Point User’s Group (IFPUG)  Counting Practices Manual (CPM 4.1).

External Inputs
An external input (EI) is an elementary process that processes data or control information that comes from  outside the application boundary. The primary intent of an EI is to maintain one or more ILFs and/or to alter  the behavior of the system.

External Outputs
An external output (EO) is an elementary process that sends data or control information outside the  application boundary. The primary intent of an external output is to present information to a user through  processing logic other than, or in addition to, the retrieval of data or control information. The processing logic  must contain at least one mathematical formula or calculation, or create derived data. An external  output may also maintain one or more ILFs and/or alter the behavior of the system.

External Inquiry
An external inquiry (EQ) is an elementary process that sends data or control information outside the  application boundary. The primary intent of an external inquiry is to present information to a user through the  retrieval of data or control information from an ILF or EIF. The processing logic contains no mathematical  formulas or calculations, and creates no derived data. No ILF is maintained during the processing, nor is the  behavior of the system altered.

It is difficult to understand these definitions and one has to read them a number of times to understand what is  the difference between EI, EO, and EQ and in which case a function would be classified as EI, EO, or  EQ.

Now the same information is presented in the tabular form as follows:

Information in Tabular Form - Click to Enlarge
PI – Primary intent; M – may be; N/A – not allowed.

This table simply says that a function can alter the behaviour of the system, it can maintain one or more ILFs,  and/or it can present information to the user. The next step is to determine whether it is EI, EO, or EQ. For  that we have to determine what is the primary intent (PI) of the function and in addition to this primary intent,  what else does it do. Identification of EQ is simple - in this case the only thing a function does is present
information to the user, which is also it’s primary intent. If it alters the behaviour of the system or maintains  and ILF then it can either be an EI or and EO but not an EQ. On the other hand if the primary intent of the  function is to present information to the user but at the same time it also performs any of the first two  operations, it is an EO. Finally, if the primary intent of the function is either to alter the behaviour of the  system of maintain one or more ILFs, then it is an EI.

Hence by putting and organizing the information in the form of a table, we have not only made it simple to  understand the definition but also given an holistic picture which was not easily visible otherwise. Let us look  at another example. This time the information is taken from the Income Tax Ordinance of Pakistan 2001.  Consider the following statement that describes the income tax rates applicable to people with different brackets:

If the taxable income is less than Rs. 60,000, there will be no income tax. If the income exceeds Rs. 60,000   but is less than Rs. 150,000 then income tax will be charged at the rate of 7.5% for income exceeding Rs.   60,000. If the income exceeds Rs. 150,000 but does not exceed Rs. 300,000 then the income tax will be  computed at 12.5% of the amount exceeding Rs. 150,000 plus Rs. 6,750. If the income exceeds Rs.  300,000 but does not exceed Rs. 400,000 then the income tax will be computed at 20% of the amount  exceeding Rs. 300,000 plus Rs. 25,500. If the income exceeds Rs. 400,000 by does not exceed Rs.  700,000 then the income tax will be computed at 25% of the amount exceeding Rs. 400,000 plus Rs.  45,500. If the income exceeds Rs. 700,000 then the income tax will be computed at 35% of the amount  exceeding Rs. 700,000 plus Rs. 120,500.

The same information can be organized in the form of a table, making it more readable and easier to use.
Income Tax
Less than Rs. 60,000 0%
Between Rs. 60,000 and Rs.
150,000
7.5% of (Income - 60,000)
Between Rs. 150,000 and Rs.
300,000
12.5% of (Income - 150,000) +
6,750
Between Rs. 300,000 and Rs.
400,000
20% of (Income - 300,000) +
25,500
Between Rs. 400,000 and Rs.
700,000
25% of (Income - 400,000) +
45,500
Greater than Rs. 700,000 35% of (Income - 700,000) +
120,500

Once the information has been organized in the tabular form, in many cases it can be simply stored and  mapped onto an array or a database table and the programming of this kind of a rule is simply reduced to a  table or dictionary lookup. This reduces the complexity of the domain and hence reduces the over all effort  for designing, coding, testing, and maintaining the system.

Our next post will be about Data Flow Model.

State Transition Diagrams

State transition diagrams (STDs) are another technique to document domain knowledge. In many cases,  information flows from one place to the other and at each place certain action is taken on that piece of  information before it moves to the next place. A file in an office is a typical office is example of such system.  In this case, different people make comments and add information to that file and it moves from one table to the other this movement is controlled by a pre-defined set of rules which define under what condition the file moves from place A to place B and so on. We can easily document these set of rules with the help of state transition diagrams.

Following is an example of a use of STD to document the life cycle of a trouble ticket (this example has been taken from ITU-X.790 document).

A Trouble report and its life cycle – and introduction
From time to time all systems, including communications networks, develop problems or malfunctions  referred to in this Recommendation as “troubles”. A “trouble” in a communications network is a problem that  has an adverse effect on the quality of service perceived by network users. When a trouble is detected,  possibly as a result of an alarm report, a trouble report may be entered by a user or the system may raise a report automatically. Management of that trouble report is necessary to ensure that it receives attention and  that the trouble is cleared to restore the service to its previous level of capability.

At the time of a trouble, a network may have been inter-working with another network to provide a service,  and the problem or malfunction may be due to the other network. Therefore it may be necessary to exchange  trouble management information between management systems across interfaces which may be  client to service provider or service provider to service provider interfaces and may represent inter- jurisdictional as well as intra-jurisdictional boundaries. In addition to exchanging information on trouble that  has already been detected, advance information on service inaccessibility may also need to be exchanged.  Thus, a service provider may need to inform a customer of future service inaccessibility (because of planned   maintenance, for example).

Trouble report states and status
Referring to the State transition diagram in Figure 2, a trouble report may go through any of six states during its life cycle. In addition, a T
rouble Status attribute is defined which qualifies the state (finer granularity) e.g. cleared
awaiting customer verification. The time at which the status attribute change is also
captured in the trouble report
.
Following is a description of states of a trouble report.

Queued
A trouble report is in a queued state when it has been instantiated but the trouble resolution process has not  yet been initiated. A trouble report which is in the queued state may be cancelled by the manager. The agent  on receiving such a request will attempt to close the trouble report.

Open/active
The trouble report becomes “open/active” when appropriate actions to resolve the trouble are initiated. An  “open/active” trouble report may be “referred” to another Hand-off Person, or “transferred” to another  Responsible Person for further processing. The state however remains unchanged as “open/active”. A  trouble report in the open/active state may be cancelled by the manager. The agent on receiving such a  request will attempt to close the trouble report.

Deferred
This state indicates that corrective action to resolve the trouble has been postponed. This can occur when the  faulty resource is inaccessible for a period and repair activity cannot proceed. A deferred  Telecommunications Trouble Report may become “open/active” again, or move directly to the “closed” state  if it is cancelled for some reason. A trouble report in the deferred state may be cancelled by the manager.  The agent on receiving such a request will attempt to close the trouble report.

Cleared
A trouble report is moved by the agent to the “cleared” state when it determines that the trouble has been  resolved. If the manager needs to verify that the trouble has been resolved, verification may optionally be  awaited by the agent prior to closure of the trouble report.

Closed
This state indicates that the trouble resolution process is complete. Upon closure, the trouble report attributes  are captured in a historical event generated at trouble report closure which may then be stored in a  log of trouble history records, for future reference. The trouble report may then be eliminated at the  agent’s convenience. However, the agent may be required to maintain such records for a period of time as  per business agreements.

Disabled
A “disabled” value is exhibited when a trouble report’s information cannot be updated due to local  conditions. In the “disabled” condition only read operations can be performed. The following figure shows  the STD for a trouble ticket. This diagram depicts the movement of a trouble ticket from one state to the  other, thus making it easy to understand.

State Transition Diagram - Click to Enlarge
The next topic will be Arranging Information in Tabular Form.

Logical System Models

4.2 Logical System Models

System models are techniques used to understand user needs and software engineer use these techniques in order to understand business domain. Software engineers develop diagrams to model different business  processes. System models include the following
  • User business processes
  • User activities for conducting the business processes
  • Processes that need to be automated
  • Processes which are not to be automated
Business process model

The first model that we will look at is called the process model. This model provides a  high-level pictorial view of the business process. This model can be used as a starting point in  giving the basic orientation to the reader of the document. Following is an example of a hospital  registration system which deals with two types of patients.
Business Process Model - Click to Enlarge
As opposed to flow charts, there are parallel activities in this diagram which are further
elaborated by specifying their major activities. The process described in this diagram is as
follows
  • A patient may come to visit In Patient Department (IPD) or output patient department (OPD)
  • System determines if he is a company patient or a private patient.
  • For a company patient, system verifies him.
  • For an OPD patient, system will issue a chit to the patient and inform him about his number and the consultant to whom he has to consult and he will have to wait for his turn.
  • After verifying an IPD patient, system will create a visit and allocate him a room or a bed etc. If  system cannot allocate this, then it will inform the patient. Otherwise the patient is checked in and his information is maintained in the system
  • System displays information about the expenses of the required service to the patient so that he is  informed of his expected expenditure. Some advance payment is also received against the required  service and this amount is adjusted in the final settlement.
  • All this information is supplied to cash office that eventually deals with payments, etc.
  • Upon receiving the cash, for OPD patient, a chit will be issued. For IPD patient, an admission form will be filled and this information will be maintained in the system. A receipt will be issued to the patient.
  • For credit transaction, corresponding voucher will be prepared.
  • So the model depicts process before the start of the treatment.
  • A patient may ask to change his service on event of an unsatisfied response from the hospital staff or  any other reason. System may cancel his record and pay his amount back.
  • Similarly, a doctor may ask a patient to change his status from OPD to IPD.
In a business process diagram, following points are important and should be noted
  • It does not describe the automated system
  • It only reflects the existing process of the user to help software engineer/analyst in understanding business domain.
  • It may contain information on processes that need not be automated
Our next post will be State Transition Diagrams.

Process Models in Software Engineering

Domain Models

During requirements analysis phase, different models are developed to express requirements of the system. Though it is difficult to draw a line between these models as they complement each other, they differ in the manner information is expressed in these models. Most of these models are pictorial and contain explanation  to the diagrams. Some of these models are discussed in the following subsections.

Understanding the business domain

It must always be kept in mind that the first step in delivering a system is establishing what needs to be driven. That is, clear understanding of the problem domain is imperative in successful delivery of a software solution. A software developer has to develop an understanding of the business problem he is trying to solve. Unless he develops this understanding, it is really difficult, if not impossible, to develop the right solution. But at least if he collects both ends (sources, sinks) involved in different processes of the business system, the corresponding requirements will be complete and yield a better understanding of the problem domain. A  software engineer works on domains that may not correspond to his field of specialization (computer science, software engineering). He may be involved in the development of an embedded application that automates the control pad of a microwave machine or a decision support application for a stock  exchange broker. As the underlying systems for which these software applications are being developed are not software systems, the software engineer cannot be expected to know about these domains. So, how should he get all the required knowledge about these systems? As without acquiring this knowledge, he may not be  able to write down complete and unambiguous requirements which are acceptable to users as well. An important difference between software and another engineering discipline is that the software engineer has to work on problems that do not directly relate to software engineering. Whereas, an electrical engineer will  work on electrical domain problems, a civil engineer will work on civil engineering problems and so on. So,  software engineer has to learn user vocabulary and terms which they use in their routine operations. To  overcome this problem, a number of domain gathering techniques are used. These techniques help in  extracting requirements from systems which are not known to a software engineer. Using these techniques  the requirements gathering and validation process becomes convenient and manageable for a software  engineer.

The following subsections discuss some of these techniques.Which will be discussed in next post and that will be Logical System Models.

Source and Sink Analysis in Software Engineering

3.14 Source and sink analysis

Once requirements are documented using any of these analysis models, an independent verification is needed to verify completeness and consistency of requirements captured through these models. The process of verifying requirements involves careful analysis of sources as well as the sinks of information.

Source

A stakeholder describes requirements (needs, constraints) to be included as system
functionality. These can be processes that generate certain information that the system
may have to process or maintain. Sources of requirements are the origins from where the
corresponding business process is initiated. By this concept, one has to trace from a
requirement back to its origins to see who is involved in its initiation. Be it a person, an
organization or an external entity that initiate some action and system responds back by
completing that action.

Sink

Sink is the consumer of certain information. It is that entity which provides a logical end to a business process. Thus, ‘sinks of requirements’ is a concept that helps in identifying persons, organizations or external systems that gets certain functionality from the system. These are logical ends of requirements, or where all the requirements are consumed. For example, we may consider a user of a software application that retrieves a report from the system. In this case, user when reviews the report, becomes the sink of that report. Thus when analyzing the sink of the requirement of implementing a report, the analyst would naturally point towards the user who would get that report.

In source and sink analysis the analyst determines all the sources of requirements and where do these requirements consume (sinks). Now evaluate a report which displays certain information, the source of this report is the data (and who enters it) that is input to be retrieved later in the form of the report. Similarly, whoever needs this report become the sink of the report.

In a similar manner, at times we gather data in our application that is not used anywhere. So the question really is what to do with that kind of unused data or the missing requirement. Is it really redundant or is something really missing from these requirements? How to figure it out?

For example, we are having certain inputs (sources) to a process against which we do not know about the corresponding outputs (sinks). Such inputs are redundant if there is found no corresponding outputs. Thus these inputs can be removed as redundant. If we probe out corresponding outputs, which could not be recorded initially, that mean these inputs were not redundant rather a few (output related) requirements were missing that we discovered during the sink analysis.

A stakeholder may have required the development team to develop certain report for his use. It means we are sure of its use (sink) but not about its sources, from where the required information will be provided? Who will input that information and using what mechanism?

A requirement statement that describe the report but do not list down its sources, will be an incomplete statement and the software engineer who is involved in validating such requirements, should identify all the sources against sinks or vice versa to determine complete end-to-end requirements

Our next post will be Process Models.

Friday, 21 December 2012

Limitation of Use Case

3.13 Limitations of Use Cases

Use cases alone are not sufficient. There are kinds of requirements (mostly nonfunctional) that need to be understood. Since use cases provide a user’s perspective, they describe the system as a black box and hide the internal details from the users. Hence, in a use case, domain (business) rules as well as legal issues are not documented.

The non-functional requirements are also not documented in the use cases. As examples of those, consider the following requirements.

  • Usability
    Color blind people should not have any difficulty in using the system – color coding should take care of common forms of color blindness.
  • Reliability
    The system needs to support 7 x 24 operation
  • Performance
    - Authorization should be completed within 1 minute 90% of the time.
    - Average authorization confirmation time should not exceed 30 seconds.
  • Portability
    The system should run on Windows 98 and above as well as Sun Solaris 7.0 and above.
  • Access
    System should be accessible over the internet – hidden requirement – security
Because of this shortcoming, use cases must be augmented by additional information.

The next post is very important for Software Engineering and we will discuss Source and Sink Analysis

Activity Diagrams in Use Case

3.12 Activity Diagrams

Activity diagrams give a pictorial description of the use case. It is similar to a flow chart and shows a flow from activity to activity. It expresses the dynamic aspect of the system. Following is the activity diagram for the Delete Information use case.

Activity Diagram - Click to Enlarge
It's a small topic but Use Case is a wide topic to learn, still it's continue so we will discuss Limitation of Use Case.

Alternative Ways of Documenting Use Case

3.11 Alternative Ways of Documenting the Use Case

Many people and organizations prefer to document the steps of interaction between the use and the system in two separate columns as shown below.
User Action System Reaction
1. The use case starts when the user wants to delete an entire set of information such as a user, commission plan, or group.
2. The user selects the set of information that he/she would like to delete and directs the system to delete the information. - Exception 1, 2 3. The system responds by asking the user to confirm deleting the information.
4. The user confirms deletion. 5. A system responds by deleting the information and notifying the user that the information was deleted from the system.

It is a matter of personal and organizational preference. The important thing is to write the use case in proper detail.

The next topic will be Activity Diagrams in Use Case.

Elaborated Use Cases

3.10 Elaborated Use Cases

After the derivation of the use case model, each use is elaborated by adding detail of interaction between the user and the software system. An elaborated use case has the following components:

  • Use Case Name
  • Implementation Priority: the relative implementation priority of the use case.
  • Actors: names of the actors that use this use case.
  • Summary: a brief description of the use case.
  • Precondition: the condition that must be met before the use case can be invoked.
  • Post-Condition: the state of the system after completion of the use case.
  • Extend: the use case it extends, if any.
  • Uses: the use case it uses, if any.
  • Normal Course of Events: sequence of actions in the case of normal use.
  • Alternative Path: deviations from the normal course.
  • Exception: course of action in the case of some exceptional condition.
  • Assumption: all the assumptions that have been taken for this use case.
As an example, the Delete Information use case is elaborated as follows:

Elaborated Use Case - Click to Enlarge
 
Use Case Name: Delete Information
Priority: 3
Actors: User
 
Summary: Deleting information allows the user to permanently remove information from the system. Deleting information is only possible when the information has not been used in the system

Preconditions: Information was previously saved to the system and a user needs to permanently delete the information.

Post-Conditions: The information is no longer available anywhere in the system.
 
Uses: Record Transactions, Cancel Action
 
Extends: None

Normal Course of Events:
  1. The use case starts when the user wants to delete an entire set of information such as a user, commission plan, or group.
  2. The user selects the set of information that he/she would like to delete and directs the system to delete the information. - Exception 1, 2
  3. The system responds by asking the user to confirm deleting the information.
  4. The user confirms deletion.
  5. Alternative Path: Cancel Action
  6. A system responds by deleting the information and notifying the user that the information was deleted from the system.
  7. Uses: Record Transaction
  8. This use case ends.
Alternative Path - The user does not confirm Deletion
  1. If the user does not confirm deletion, the information does not delete.
  2. Uses: Cancel Action
Exceptions:
  1. The system will not allow a user to delete information that is being used in the system.
  2. The system will not allow a user to delete another user that has subordinates.
Assumptions:
  1. Deleting information covers a permanent deletion of an entire set of data such as a commission plan, user, group etc. Deleting a portion of an entire set constitutes modifying the set of data.
  2. Deleted information is not retained in the system.
  3. A user can only delete information that has not been used in the system.

Relationship among Use Cases

3.9 Relationship among Use Cases

The UML allows us to extend and reuse already defined use cases by defining the relationship among them. Use cases can be reused and extended in two different fashions: extends and uses. In the cases of “uses” relationship, we define that one use case invokes the steps defined in another use case during the course of its own execution. Hence this defines a relationship that is similar to a relationship between two functions where one makes a call to the other function. The “extends” relationship is kind of a generalization specialization relationship. In this case a special instance of an already existing use case is created. The new use case inherits all the properties of the existing use case, including its actors.

Let is try to understand these two concepts with the help of the following diagrams. In the case of the first diagram, the Delete Information use case is using two already existing use cases namely Record Transaction and Cancel Transaction. The direction of the arrow determines which one is the user and which use case is being used.

Use Case Transaction - Click to Enlarge
Use Case Cellular Telephone - Click to Enlarge

The second diagram demonstrates the concept of reuse by extending already existing use cases. In this case Place Conference Call use case is a specialization of Place Phone Call use case. Similarly, Receive Additional Call is defined by extending Receive Phone Call. It may be noted here that, in this case, the arrow goes from the new use case that is being created (derived use case) towards the use case that is being extended (the base use case).

This diagram also demonstrates that many different actors can use one use case. Additionally, the actors defined for the base use case are also defined by default for the derived use case.

The concept of re-usability can also be used in the case of actors. In this case, new classes of actors may be created by inheriting from the old classes of actors.

Credit Card Validation System - Click to Enlarge
In this case two new classes, Individual Customer and Corporate Customer, are being created by extending Customer. In this case, all the use cases available to Customer would also be available to these two new actors.

In the next post we will discuss about Elaborated Use Case.

Use Case Model Component

3.8 Use Case Model Components

A use case model has two components, use cases and actors.

In a use case model, boundaries of the system are defined by functionality that is handled by the system. Each use case specifies a complete functionality from its initiation by an actor until it has performed the requested functionality. An actor is an entity that has an interest in interacting with the system. An actor can be a human or some other device or system.

A use case model represents a use case view of the system – how the system is going to be used. In this case system is treated as a black box and it only depicts the external interface of the system. From an end-user’s perspective it and describes the functional requirements of the system. To a developer, it gives a clear and consistent description of what the system should do. This model is used and elaborated throughout the development process. As an aid to the tester, it provides a basis for performing system tests to verify the system. It also provides the ability to trace functional requirements into actual classes and operations in the system and hence helps in identifying any gaps.

Use Diagram for a Library System

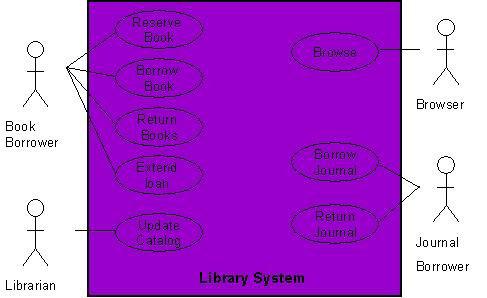
As an example, consider the following use case diagram for a library management system. In this diagram, there are four actors namely Book Borrower, Librarian, Browser, and Journal Borrower. In addition to these actors, there are 8 use cases. These use cases are represented by ovals and are enclosed within the system boundary, which is represented by a rectangle. It is important to note that every use case must always deliver
some value to the actor

Use Case Model for Library System - Click to Enlarge
.With the help of this diagram, it can be clearly seen that a Book Borrower can reserve a book, borrow a book, return a book, or extend loan of a book. Similarly, functions performed by other users can also be examined easily.

Creating a Use Case Model

Creating a use case model is an iterative activity. The iteration starts with the identification of actors. In the next step, use cases for each actor are determined which define the system. After that, relationships among use cases are defined. It must be understood that these are not strictly sequential steps and it is not necessary that all actors must be identified before defining their use cases. These activities are sort of parallel and concurrent and a use case model will evolve slowly from these activities. This activity stops when no new use cases or actors are discovered. At the end, the model is validated.

In the next post we will see moreover on Relationship among use Cases

Context Diagram in Software Engineering

The Context Diagram

The scope description establishes the boundary between the system we are developing and everything else in the universe. The context diagram graphically illustrates this boundary by showing the connections between the system being developed or the problem being addressed, and the outside world. The context diagram identifies the entities outside the system that interface to it in some way (called terminators or external entities), as well as the flow of data and material between each external entity and the system. The context diagram is used as the top level abstraction in a dataflow diagram developed according to principles of structured analysis. The context diagram can be included in the vision and scope document, in the SRS, or as part of a dataflow model of the system.

Following is a context diagram of the chemical tracking system.

Context Diagram - Click to Enlarge

Use Cases and Customer-Developer Relationship

It has been mentioned earlier on, excellent software products are the result of a well executed design based on excellent requirements and high quality requirements result from effective communication and coordination between developers and customers. That is, good customer-developer relationship and effective  communication between these two entities is a must for a successful software project. In order to build this relationship and capture the requirements properly, it is essential for the requirement engineer to learn about the business that is to be automated.

It is important to recognize that a software engineer is typically not hired to solve a computer science problem – most often than not, the problem lies in a different domain than computer science and the software engineer must understand it before it can be solved. In order to improve the communication level between the vendor and the client, the software engineer should learn the domain related terminology and use that terminology in documenting the requirements. Document should be structured and written in a way that the customer finds it easy to read and understand so that there are no ambiguities and false assumption.

One tool used to organize and structure the requirements is such a fashion is called use
case modeling.
It is modeling technique developed by Ivar Jacobson to describe what a new system should do or what an existing system already does. It is now part of a standard software modeling language known as the Unified Modeling Language (UML). It captures a discussion process between the system developer and the customer. It is widely used because it is comparatively easy to understand intuitively – even without knowing the notation. Because of its intuitive nature, it can be easily discussed with the customer who may not be familiar with UML, resulting in a requirement specification on which all agree.

In the next we will see Component of Use Case Model (UML).

Component of Software Requirements

The following figure depicts the relationship between different documents produced during the requirement engineering phase.

Component of Software Requirements - Click to Enlarge

Business Requirements

Business requirements collected from multiple sources might conflict. For example, consider a kiosk product with embedded software that will be sold to retail stores and used by the store’s customers. The kiosk developer’s business objectives include the following:

  • leasing or selling the kiosk to the retailers 
  • selling consumables through the kiosk to the customer
  • attracting customer to the brand
  • modifying the nature of the historical developer-customer relationship
The retailer’s business interest could include:
  • making money from customer use of kiosk
  • attracting more customers to the store
  • saving money if the kiosk replaces manual operations
The developer might want to establish a high-tech and exciting new direction for customers, while the retailer wants a simple solution and the customer wants convenience and features. The tension among these three parties with their different goals, constraints, and cost factors can lead to conflicting business requirements, which must be resolved before the kiosk’s software requirements are detailed.

You can also use the business requirements to set implementation priorities for use cases and their associated functional requirements. For example, a business requirement to generate maximum revenue from the kiosk would imply the early implementation of features directly associated with selling more products or services to the customer, rather than glitzy features that appeal to only a subset of customers.

The Vision Statement

The vision statement should reflect a balanced view that will satisfy the need of diverse customers. It can be somewhat idealistic but should be grounded in the realities of existing or anticipated customer markets, enterprise architectures, organizational strategic directions, and resource limitations.

Chemical Tracking System

The chemical tracking system will allow scientists to request containers of chemicals to be supplied by chemical stockroom or by vendors. The location of every chemical container within the company, the quantity of the material remaining in it, and the complete history of each container’s location and usage will be known by the system at all times. The company will save 25% on chemical costs by fully exploiting chemicals already available within the company, by disposing of fewer partially used or expired containers, and by using a standard chemical purchasing process. The chemical tracking system will also generate all reports required to comply with federal and state government regulations that require the reporting of chemical usage, storage, and disposal.

Assumptions and Dependencies

All assumptions that were made when conceiving the project have to be recorded. For example, the management sponsor for the chemical tracking system assumed that it would replace the existing chemical stockroom inventory system and that it would interface to the appropriate purchasing department  applications.

Scope
Project scope defines the concept and range of the proposed solution, and limitations identify certain capabilities that the product will not include. Clarifying the scope and limitations helps to establish realistic stakeholder’s expectations. Sometimes customers request features that are too expansive or do not lie within the intended project scope. Propose requirements that are out of scope must be rejected, unless they are so beneficial that the scope should be enlarged to accommodate them (with accompanying changes in budget, schedule, and staff). Keep a record of these requirements and why they were rejected, as they have a way of reappearing.

Scope and Initial Release
 
The major features that will be included in the initial release of the project should be summarized. Describe the quality characteristics that will enable the product to provide the intended benefits to its various customer communities. Requirements need to be prioritized and a release schedule should be made.

The next topic will be Context Diagram.